Featured

Fiduciary Tools

Investments

News and Updates

Introducing the PCI 401(k) Investment Lineup vs. Passive Scorecard Annual Report

Last Updated: January 20, 2024

In 2018, PCI sponsored a research paper with the University of Missouri. The primary objective of this research was to answer a crucial question: “Do 401(k)—and other Defined Contribution (DC) plan—investment lineups outperform all-index lineups?”

PCI is excited to present the findings of this ongoing research in the “401(k) Investment Lineup vs. Passive Scorecard” (ILPS) Annual Report.”

PCI has served as a registered investment adviser since 1994, overseeing investment manager selection for the company-sponsored retirement plans under our care. In the ’90s and early 2000s, when the retirement industry was still early in its development, plan advisers were not particularly focused on investment lineup performance. At the time, there was no definitive answer or industry-wide accepted method to measure investment lineup performance within 401(k) plans. It was often assumed that professionally selected funds within company-sponsored retirement plans would be good investment options for plan participants.


We have always recognized the significance of investment performance in 401(k) plans and the impact that the selected investments have on delivering meaningful results for plan participants. However, as more evidence mounted that active management frequently underperforms passive management, we wanted to measure our own success. Were we adding value to plan participants through our manager (i.e. fund) selection? This would require a benchmark, or standard for success. Unfortunately, we found that a challenge lay in the absence of a clear, industry-wide method for measuring investment lineup performance within 401(k) plans.


On September 1st, 2015, we adopted our own performance standard for our manager selection, and subsequently began reporting that performance to our clients.


As we began monitoring our own manager selection performance for 401(k) lineups, we naturally became curious about how other 401(k)s and similar plans perform relative to the performance standard we adopted. What was needed was an objective, academic analysis and report, similar to the S&P Indices Versus Active (SPIVA) Report and the Morningstar Active vs Passive Investment Management Barometer Report. These reports compare actively managed mutual funds to their passive indices. Notably, none of the standard reports focused exclusively on institutionally managed investment lineups within 401(k)s (and related) plans.


About the Original Methodology

In our efforts to contribute to the knowledge base of the industry and address the question, ‘Do 401(k) investment lineups outperform all-index lineups?’ we collaborated with Dr. Rui Yao, Ph.D., CFP®, Professor and Director of Graduate Studies of Personal Finance Planning at the University of Missouri.


We sponsored an academic research paper titled Use of Advisors and Retirement Plan Performance. This paper introduces a method for assessing whether investment options in Defined Contribution (DC) Plans, such as 401(k)s, perform better than similar market indices. In simpler terms, it indicates whether the funds included in 401(k) lineups benefit plan participants, compared to if they were invested in the corresponding and relative index. This information is crucial for a nation relying on DC plans as the primary means for its workers’ retirement.


Research for the paper first began in 2018. The report, led by Dr. Yao, Ph.D., CFP®, and co-authored by Weipeng Wu, MA, Doctoral Student in Personal Financial Planning at the University of Missouri, and Cody Mendenhall, CFP®, Principal at PCI, underwent extensive research before its submission in 2019. The paper was peer-reviewed and published by the Journal of Financial Counseling and Planning in November 2020.


In addition to looking at plan lineup performance, the paper examined if professional advice for fund selection positively contributed to the plan they service. The paper’s authors hypothesize that retirement plans that work with an adviser should perform better, in that, they have higher returns, lower risks, and higher risk-adjusted returns. What the research found is that this is not necessarily the case.


When looking at the plan level for the study’s examined years (2013-2015), controlling for plan size and use of advisers in the study, working with an adviser was significantly and negatively related to retirement plan performance in 2013, the best year of market returns, and had slight or no significant positive outcomes in the two latter years. They also had less chance to beat their benchmark in terms of total risk and did not outperform their benchmark in three separate evaluation panels.


You can view the findings in the full study on the Department of Education’s resource center here.


PCI’s Annual ILPS Report

Since then, we have engaged Dr. Yao to continue the research and provide an annual update. The findings of this research are then presented in PCI’s 401(k) Investment Lineup vs. Passive Scorecard Annual Report. Although the annual update no longer evaluates adviser contribution to investment lineup performance, it does utilize the methodology established in the original study to compare investment lineups (adviser and non-adviser) to an all-index lineup.


Each year, the findings are gathered by analyzing approximately 5,000 randomly selected plans that offer mutual funds to their participants. These plans must have at least 100 participants and assets over $1 million. The report evaluates performance both at the individual fund-level as well as the overall plan level.


The report considers several methods for determining if a fund outperforms its assigned index during a calendar year. Table 1 reports the number of the total population and the sample of each fund size category. Table 2 reports the mean ratio of funds in plans that outperformed their benchmark. Table 3 reports the percentage of plans in general and in each size category that outperformed their benchmark. The performance measures five panels of analysis for both the fund level and the plan level. The panels include higher expected return, lower risk (standard deviation), higher Sharpe ratio, lower downside risk, and higher Sortino ratio.


ILPS 2020 Results:
When you examine the results from the latest update for the 2020 year at the plan level, the percentage of plans that achieved a higher expected return than their corresponding benchmark was 75.51%. The update finds that, generally, the larger the plan size, the better the performance. When adjusting for risk, the average of plans that outperformed was 52.59%. The only notable exception among all panel categories was the largest plans with a market value of $500 million or more. These plans resulted in 72.46% for the higher expected return panel and only 31.14% when adjusted for risk.


When analyzed year-over-year, however, the ILPS Report finds that this level of plan outperformance is uncommon. In fact, plan investment lineups significantly underperform all-index lineups most years. This was clearly demonstrated in 2018 and 2019 when only 27.86% and 25.07% of plans outperformed in the higher expected return panel (A). When delving even further back, such as in 2014 and 2016, returns for all plans were as low as 10.59% and 11.96%, respectively.


The ILPS also demonstrates that outperformance is possible, as shown in 2017 when a resounding 82.66% of the plans outperformed the benchmark. Unfortunately for participants of these plans, this is not a common occurrence over time.


You can view the results from all reported years in our new ILPS Report official location. The update for the 2021 year is anticipated to be published in May 2024. To make sure you get alerted for the next annual update, sign up for PCI’s latest news and updates here.

Small Improvements Can Make a Big Difference

Learn more about how small improvements in your investment lineup’s performance, compounded over a working career, can dramatically improve the retirement readiness of your employees.

To stay up to date on all things industry-related, follow us on Twitter and LinkedIn.


If you’d like to address your participants’ retirement readiness, we welcome you to schedule a consultation with our team of experts. Together, we can make a positive impact on your employee’s financial security.

Fiduciary Committee Training Workshop

Learn How to Be an Effective 401(k) Fiduciary Committee Member for Your Employees

Reserve your spot for our upcoming workshop.

WRITTEN BY

Pension Consultants, Inc.

Image

FREE DOWNLOAD

Read The First Chapter

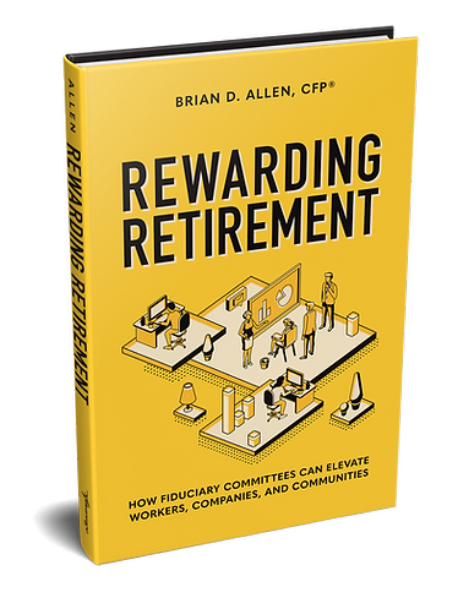
Learn what it takes to build a successful retirement plan so your employees can retire on time and with dignity. A must read for any fiduciary.

We promise to never spam you or sell your information. For more, read our privacy policy or terms and conditions


WHAT’S INSIDE

1

A good plan measures
three key elements:
contributions,
investments, and fees.

2

A good plan serves
employees and
employers.

3

Fiduciaries have a
responsibility to make
reasonable decisions
with their employees’
best interests in mind.

Ready to Evaluate Your Plan’s Performance?


How we can help

1

Speak with an adviser who can evaluate your plan in the three critical areas.

2

Understand how your current plan is performing.

3

Learn what you can do to improve your plan’s performance.